Even the most enthusiastic value investors know technical analysis is critical to well-informed investing. Major news outlets often tout momentum investing as outperforming value-based strategies over the past decade. Likewise, financial service firms showcase the impact of these technical trading strategies and factors.
This article focuses on a specific technical analysis, the Triangle Chart Pattern. We’ll explain what it is, its different types, and how to best use it.
What is a triangle pattern?
A triangle pattern is technical analysis tool that signals what’s known as a continuation pattern: an equity or currency’s price movement within a specific range after the trend falls or rises. The triangle pattern is used to identify whether the next move in the security is a breakout higher or a breakdown in pricing towards aligned with a bearish sentiment.
Traders versed in technical analysis use the triangle chart pattern to identify whether the current price movement of a stock or currency is bearish or bullish after substantial volatility and newfound upside or downside. As the triangle pattern forms, traders pause and analyze the signals to assess what may come next.
After range-bound trading, the price movement will often continue the same pattern. If it is an uptrend, it is known as a breakout. However, that pattern can fail, and the pricing trend can suddenly and viciously reverse. This is known as a pricing breakdown. As such, making trading decisions based on triangle patterns requires a nuanced understanding of the rules and knowledge of the different types of triangle patterns.
Understanding Triangle Patterns – What are the rules of triangle patterns?
There are no specific rules for interpreting triangle patterns. Instead, there are general guidelines that traders follow in identifying these patterns. Some of these guidelines include:
- Triangle patterns are often considered continuation patterns. In this case, triangles are used to identify breakouts for profitable trades. This consideration is especially true for smaller patterns and often presents the best trading opportunities.
- Conversely, larger patterns in triangles are considered both a continuation trend pattern and an indicator of a reversal trend.
- Breakout of patterns in either direction is often considered to be confirmed when accompanied by a healthy volume increase.
Type of Triangles
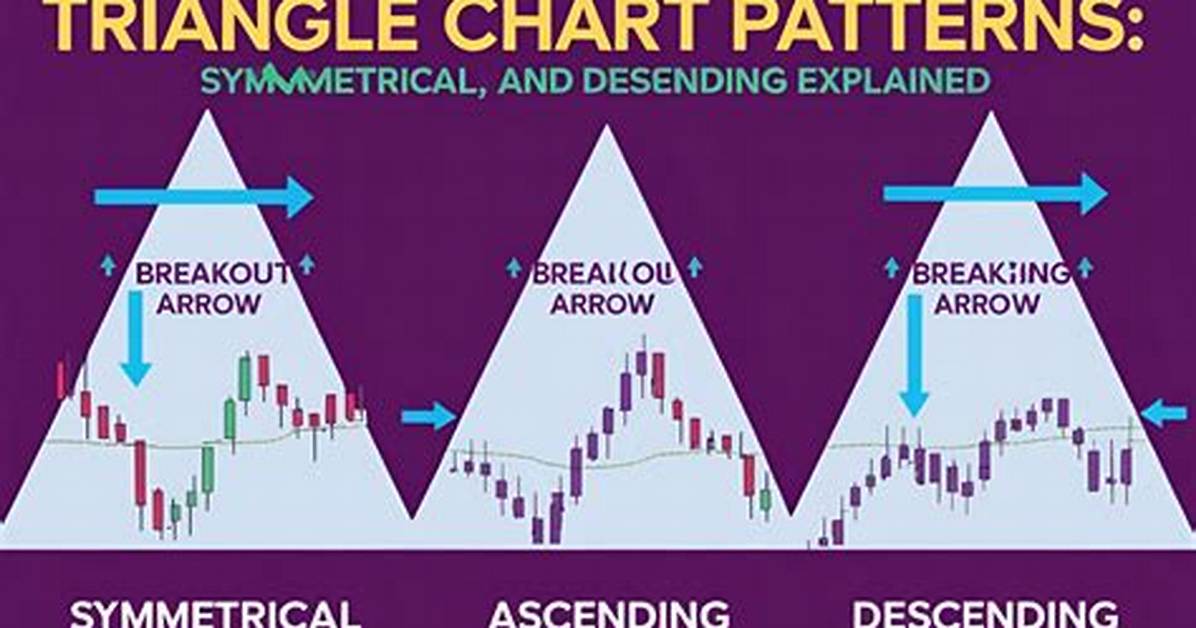
There are three types of triangle chart patterns. These include:
- Ascending Triangle – this is a pricing pattern in which the equity is attempting to make multiple attempts at a new high, but none go above a certain threshold. One can draw a straight horizontal upper trendline across the price chart directly above all those highs. Simultaneously, as the price drops back down from that threshold, the low the price reaches is always higher than the last low that was set. One can draw a straight upward-sloping lower trendline across the price chart directly below all those lows.
This pricing momentum indicates increasing confidence among buyers, slowly increasing their bids to place a rising floor on the price.
This confidence-building transpires slowly and then suddenly as buyers detect the rising trend, and all race to buy at once to avoid missing out on the gains. This manifests a massive breakout higher in price as sufficient buyers have stepped in.
- Descending Triangle – this triangle formation is the inverse of the ascending triangle. In this pricing pattern, the equity or currency makes lower highs at every attempt after an ongoing downward trend before the triangle formation. One can draw a straight downward-sloping trendline across the top of the chart.
This is usually a result of buyers sensing an opportunity to bid after an ongoing downturn, slowly easing back into the trade. At this triangle formation, the pricing trend is usually unsustainable and often continues back towards the downward trend, breaching the lower trendline.
However, it is essential to note that this isn’t a certainty that this will always happen. There is a breakout strategy to be employed depending on the market dynamics and bullishness. As a result, there may be a case for the trend to reverse and break out higher. So it is always important to pay attention to market conditions overall and the narratives driving those trends.
- Symmetrical Triangle – this is a unique triangle formation as the top and bottom trendlines converge to the middle towards one another. It is a tug of war between buyers and sellers where the highs are lower than the prior, and the lows are lower than the earlier lows.
Symmetrical triangle patterns can be tricky as traders must carefully review for the potential of a breakout in prices to move higher or a breakdown of prices where the trend turns bearish. As a result, a symmetrical triangle pattern isn’t sufficient to independently guide pricing movement and must be used in tandem with other types of technical analysis.

